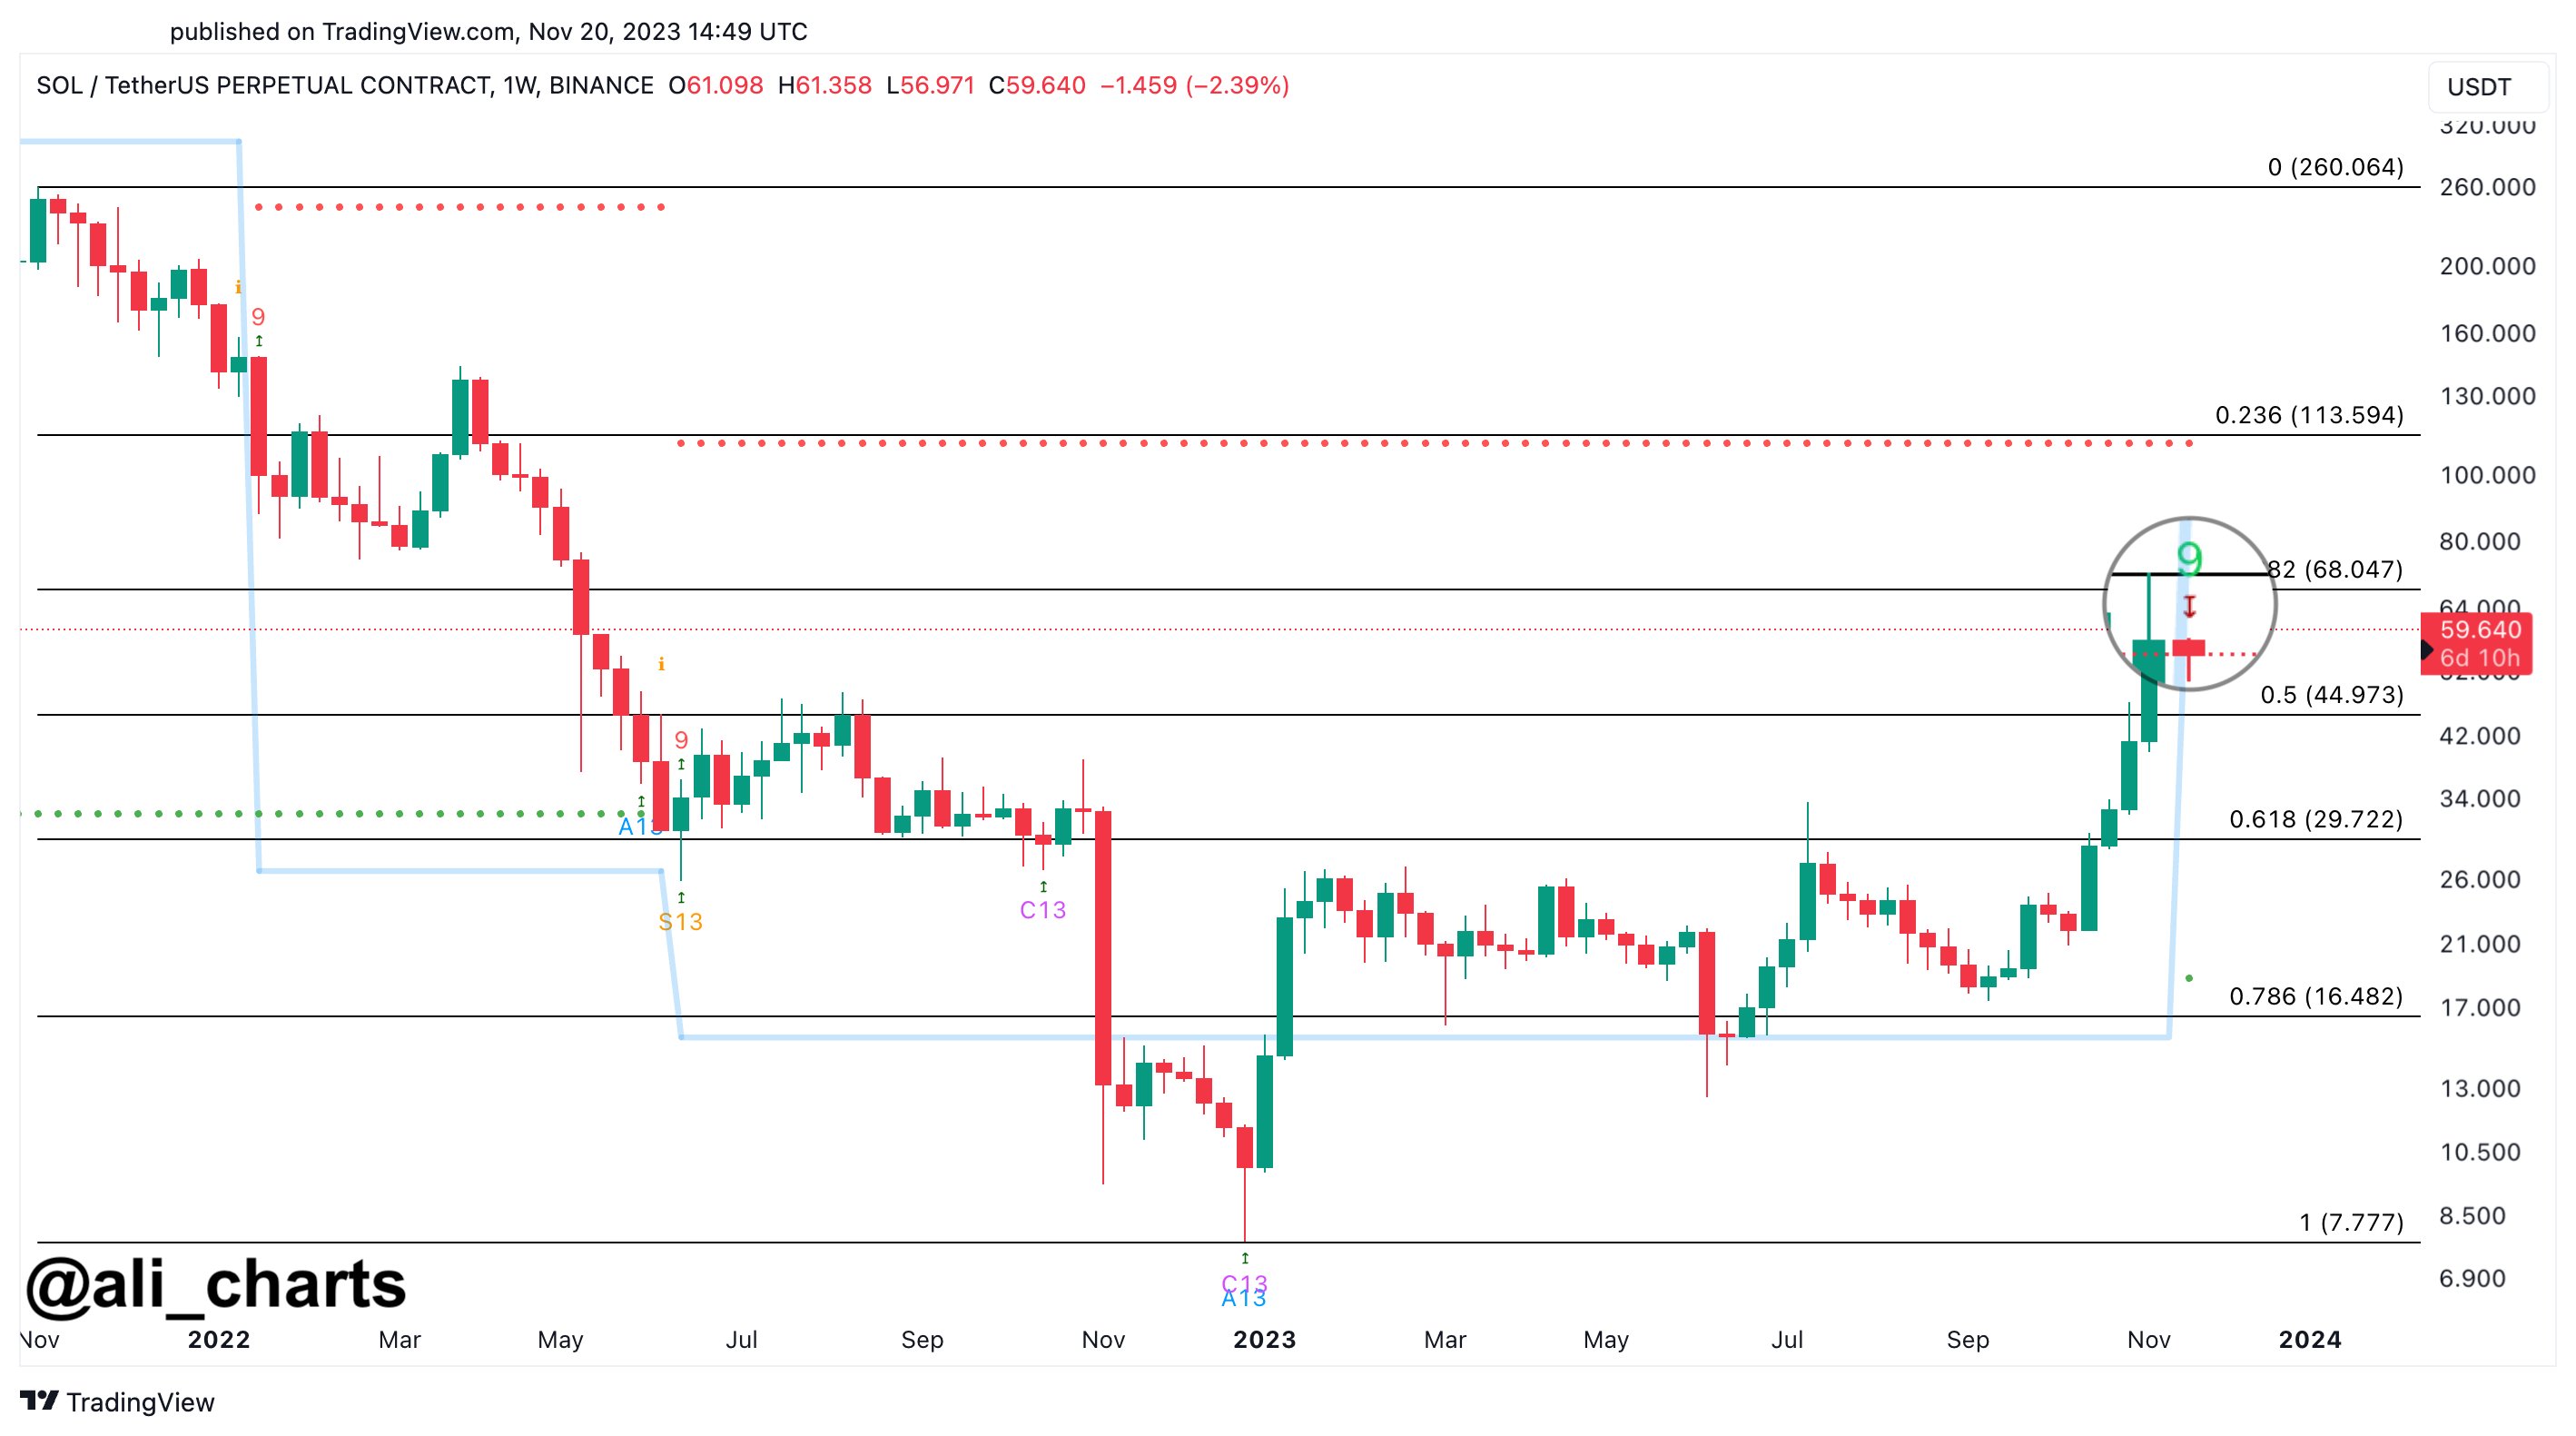
Solana is forming a TD Sequential sell signal on the weekly chart right now and this analyst believes a decline to as low as $30 could happen for SOL.
Solana Weekly Chart Is In Process Of Forming A TD Sequential Sell Signal
The “Tom Demark (TD) Sequential” refers to a popular tool in technical analysis that’s used to pinpoint probable tops or bottoms in the price of any given asset or commodity.
This indicator is made up of two phases: the setup phase and the countdown phase. In the former, candles of the same polarity are counted up to 9. After this ninth candle, the metric signals that a likely reversal in the price is occurring now.
Naturally, if the setup occurs with green candles, the signal would be for a probable top, meaning that it could be the time to exit from the asset. On the other hand, the opposite type of candle would imply a reversal from the bearish trend may be taking place.
As explained by analyst Ali in a new post on X, the Solana 7-day chart has recently been finishing such a setup phase of the TD Sequential, suggesting the winds might be changing for the cryptocurrency.
The below chart shared by the analyst shows this signal forming in SOL’s price:

The pattern currently forming in the coin's weekly price chart | Source: @ali_charts on X
From the graph, it’s visible that this Solana signal could be a sell one, as the TD Sequential setup phase is forming with green candles. “With the week just beginning, the upcoming days could be crucial for traders eyeing profit-booking opportunities,” notes Ali.
As mentioned before, this phase isn’t the only one that the indicator has; there is also the “countdown phase.” This second phase lasts for 13 candles and starts right after the setup is finished.
Once these 13 candles are done, the asset’s price could once again be assumed to have reached a state of exhaustion in its trend and a reversal may be imminent.
“If the bearish formation gets confirmed, we might see a SOL downswing towards $45, potentially even dipping to $30,” explains the analyst. The former target would mean a decline of more than 21% from the current price of the coin, the latter 47%.
It now remains to be seen whether the bearish pattern will hold for the cryptocurrency after all. If it does, the TD Sequential may once again be the metric to watch, as the countdown phase’s end could lead to a reversal in the asset’s price once more.
SOL Price
Solana had gone as high as $68 last week, but the cryptocurrency has since seen a sizeable drop towards the $57 mark. Nonetheless, despite this decline, the asset is in profits of more than 100% in the past month, showcasing just how strong SOL’s recent bullish momentum has been.

The coin is still holding great returns for the past month | Source: SOLUSD on TradingView
Featured image from Shutterstock.com, charts from TradingView.com


